
Media Coverage Spotlights Primary Care Access Problems Based on MHQP Data and Insights
(April 2024)
MHQP is pleased to have played a key role in providing data, insights and connections to help create several recently published prominent stories about the critical issue of primary care access in Massachusetts.
Please note that the Boston Globe articles are behind a paywall.
 Boston Globe: April 26, 2024
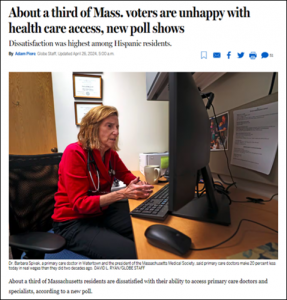
This story by Adam Piore, which focuses on a new Suffolk University/Boston Globe poll of 500 Massachusetts voters, reveals that about a third of the state’s residents are dissatisfied with their ability to access primary care doctors and specialists. MHQP’s CEO, Barbra Rabson, is featured prominently in the article, as is our former board member, Barbara Spivak, MD.
Click HERE or on the image to the left to read the article.
 The Boston Globe: April 11, 2024
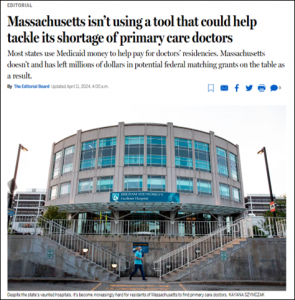
The Boston Globe featured MHQP and CHIA data in an editorial on April 11th that recommends Massachusetts tap into Medicaid money to help address the primary care provider shortage in our state. According to the editorial, Massachusetts is one of only seven states that does not use Medicaid money to fund medical residencies, and is the only state among the 10 states with the most teaching hospitals and physician residents that does not use Medicaid money to support graduate medical education.
Click HERE or on the left to read the editorial.
 WBUR: April 3, 2024
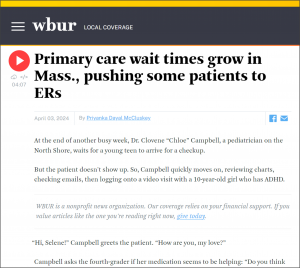
Thanks to Priyanka Dayal McCluskey of WBUR for a terrific story on NPR about the current crisis in primary care access in Massachusetts. Barbra Rabson contributes significantly to the discussion.
Click HERE or on the image to the left to listen to or read the story.
 Boston Globe: March 12, 2024
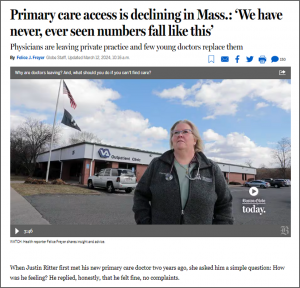
Many thanks also to Felice Freyer, whose March 12th article in the Boston Globe on the same topic also prominently featured Barbra and other MHQP data and stakeholders.
Click HERE or on the image to the left to read the story.
 Commonwealth Beacon: May 16, 2024
“By almost every significant metric, primary care in Massachusetts is moving in the wrong direction, according to a new report. The system is now bleeding primary care doctors faster than the national rate, bellwether screening rates for some cancers are down, and demographic disparities in accessing care remain. The Center for Health Information and Analysis and Massachusetts Health Quality Partners unveiled a primary care dashboard to track the situation, and officials from both organizations sounded alarm bells at the initial findings.”
Click HERE or on the image to the left to read the story.